
Page 2422 - Week 06 - Friday, 27 June 2008
Next page . . . . Previous page . . . . Speeches . . . . Contents . . . . Debates(HTML) . . . . PDF . . . .
If construction of the demonstration Water Purification Plant goes ahead, ACTEW will also review its system of water quality monitoring throughout its water and wastewater systems. Water quality would be constantly monitored and tested at key points in ACTEW’s water treatment facilities, to ensure the quality of water at each stage of the treatment process.
(3) It is difficult to provide specific yearly figures on water use between households, private enterprise and government for two key reasons.
Firstly water usage amounts for these users currently need to be taken from their water bills. Many water meter readings for the bills cross over calendar years, for example one reading could include December 2007 -February 2008. It is, therefore, extremely difficult to determine the exact calendar year usage for each sector.
Furthermore, as Government agencies can occupy whole, or part, of buildings that are owned by private entities, it is difficult to differentiate water use between Government and private enterprise use. This is because a water usage amounts from such buildings would be taken from the water bills which the owner of the building receives, and do not specifically identify water use according to occupant.
However, it is possible to provide the exact amount of water used for the whole of the ACT per day and calendar year through the ACT’s daily water consumption figures.
I note that residential properties in detached homes generally consume the greater portion of the city’s overall usage. This is because the ACT does not have large industries or agriculture that would put significant demands on the water supply. The following chart provides an indication of how water is currently used in the ACT.
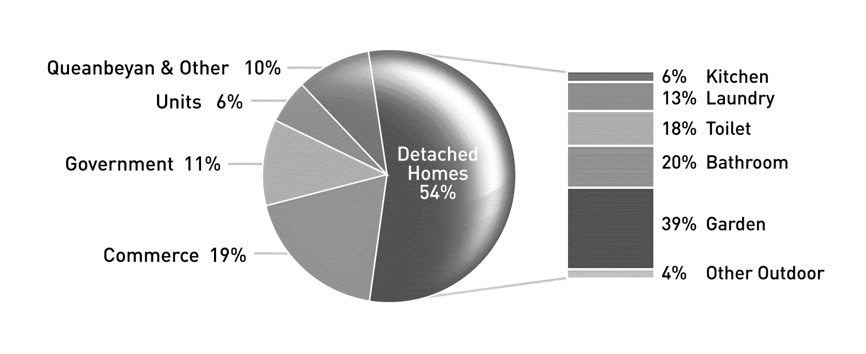
The above chart was developed as part of the ACT Government’s 2004 Think water, act water strategy. Although overall water consumption in the ACT has reduced since that time due to mandatory water restrictions, the percentages of water used by each sector are not expected to have changed dramatically.
Daily and annual water use figures for the ACT for the last 10 year period are attached (Attachment A).
(A copy of the attachment is available at the Chamber Support Office).
Next page . . . . Previous page . . . . Speeches . . . . Contents . . . . Debates(HTML) . . . . PDF . . . .